Have you ever wanted to gather data on the status of your messages but do not want to go through the hassle of checking each message individually? SignalWire hopes that all of our customers are able to utilize our products to revolutionize telecom and it all begins with successful delivery. If you share this sentiment with us then look no further as we dive into a few statistical methods to help further analyze the activity within your SignalWire Space.
Well, what are we going to do?
The power of APIs cannot be understated. In this example we are going to create an API request to gather status information on many messages all at once. From this pulled data, this code will also give an introduction to creating plots through matplotlib, creating data frames through pandas, and lastly how to format appropriate data to identify potential issues.
What you need to run the code
You must have the SignalWire Python SDK installed. You can install that here.
Python REST API will be used with the assistance of some packages: matplotlib.pyplot, pandas, and datetime.
Change the following variables
- ProjectID - Your project ID is an alphanumeric string that tells the SignalWire SDK where to find your project. You can find this in an easily copyable format by going to your SignalWire Portal and clicking the API tab on the lefthand side.
- AuthToken - Your Auth Token is an alphanumeric string that helps to authenticate your HTTP requests to SignalWire. You can create this (if you haven’t already) or copy this in an easily copyable format by going to your SignalWire Portal and clicking the API tab. If you have not created an API token, press the blue new button. If you have, click show and copy the string.
- SpaceURL - Your space URL is the domain of your space, i.e. example.signalwire.com. This can also be found in an easily copyable format within the API tab in your SignalWire space.
- Change the date and from number when calling clients.messages.list() to specify the date range and from number that you need. If you are filtering by another parameter, you can add it within client.messages.list()
- Numbers – Populate the ‘numbers’ array towards the end of the code, with the numbers that you are wanting to analyze. These must be formatted as ‘+1XXXYYYZZZZ’
The Code
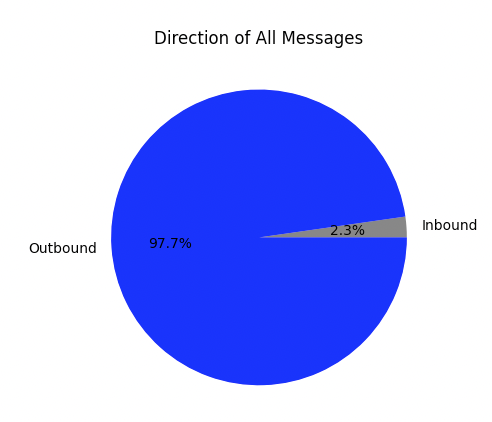
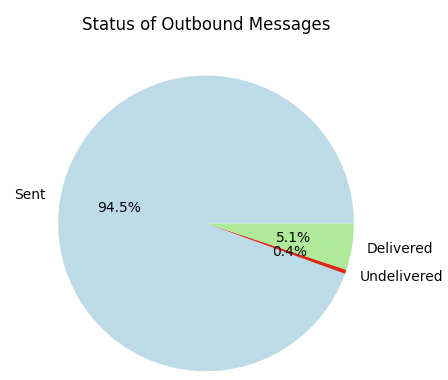
Sample Outputs
Comments
This code introduced to you three different techniques to view information given by SignalWire APIs. We learned how to create a plot through myplotlib, how to create a data table through pandas, and lastly how to declare variables to further print out console-friendly outputs. More resources on these python specific packages are listed below and I highly recommend looking at all of the neat customizations that are possible.
Getting Started
If you are looking for more information about using SignalWire, refer to our Getting Started guide.
Please feel free to reach out to us on our Community Slack or create a Support ticket if you need guidance!
Start a free trial
If you would like to test this example out, you can create a SignalWire account and space here.