What Is AI Observability?
AI observability is the ability to see exactly what happened during a call: which components ran, in what order, how long each took, and why the AI made the decisions it did. It's also one of the most common (and most overlooked) challenges in voice AI development. If you're building or running a voice AI system, you've likely run into observability problems without having a name for it: everything looks fine on the dashboard, but callers keep hanging up frustrated.
Here's why that happens.
Voice AI pipelines are made up of multiple systems working together: speech recognition, language models, text-to-speech, telephony, and more. Each one can appear perfectly healthy in isolation. But when a call goes wrong, the failure often lives in the gaps between those systems. A response came back just a second too slow, an awkward silence felt like a dead line, a perfectly transcribed sentence got routed to the wrong intent.
None of those failures flag an error or signal a problem on a standard monitoring dashboard.
This is the core observability problem in voice AI: you can't debug what you can't see. And most voice AI systems are assembled from third-party components that their builders don't fully control, which means they also can't fully instrument proper observability.
The good news is that this is a solvable problem when you build voice AI on SignalWire with the help of the PostPrompt Ingestion Engine.
What native AI observability actually requires
True voice AI observability requires owning four things simultaneously:
The state machine
When the platform governs the AI's allowed states and transitions, it can record every step change: what caused it, what tools were available at that step, and what data the model could see.
The media path
When the platform handles audio end-to-end, it can measure ASR processing time, TTS rendering time, barge-in timing at the audio level, and total end-to-end delay.
Tool execution
When the platform runs function calls, it can record which function was called, how long it took, whether it succeeded, and what the response was.
The conversation lifecycle
Session boundaries, data collection flow, error recovery, and context switches are only visible to a platform that governs the full interaction.
Native observability is a natural consequence of owning the stack. Every event that matters passes through infrastructure the platform already controls. Instrumenting it is a matter of recording what is already visible.
This is why most bolt-on observability tools fall short. A wrapper sitting between your application and its dependencies can log prompts, responses, and API latency. It cannot see inside the ASR engine, measure TTS rendering time, or observe state machine transitions, because the platform it’s monitoring does not own those things. You cannot instrument what you do not control.
SignalWire’s AI observability tool: PostPrompt Ingestion Engine (P.I.E.)
P.I.E. is an open-source full-stack application built specifically for SignalWire AI agents. It ingests, stores, searches, and visualizes the post-conversation webhook payload that SignalWire sends at the end of every call.
That payload is rich: per-response latency broken down by component, ASR confidence scores, barge-in timing, every tool call with its arguments and response, data collection flow events, error classification, session timestamps, and a structured event timeline. P.I.E. takes all of it and makes it browsable.
Before building one yourself, you can try out our demo version to explore all its capabilities.
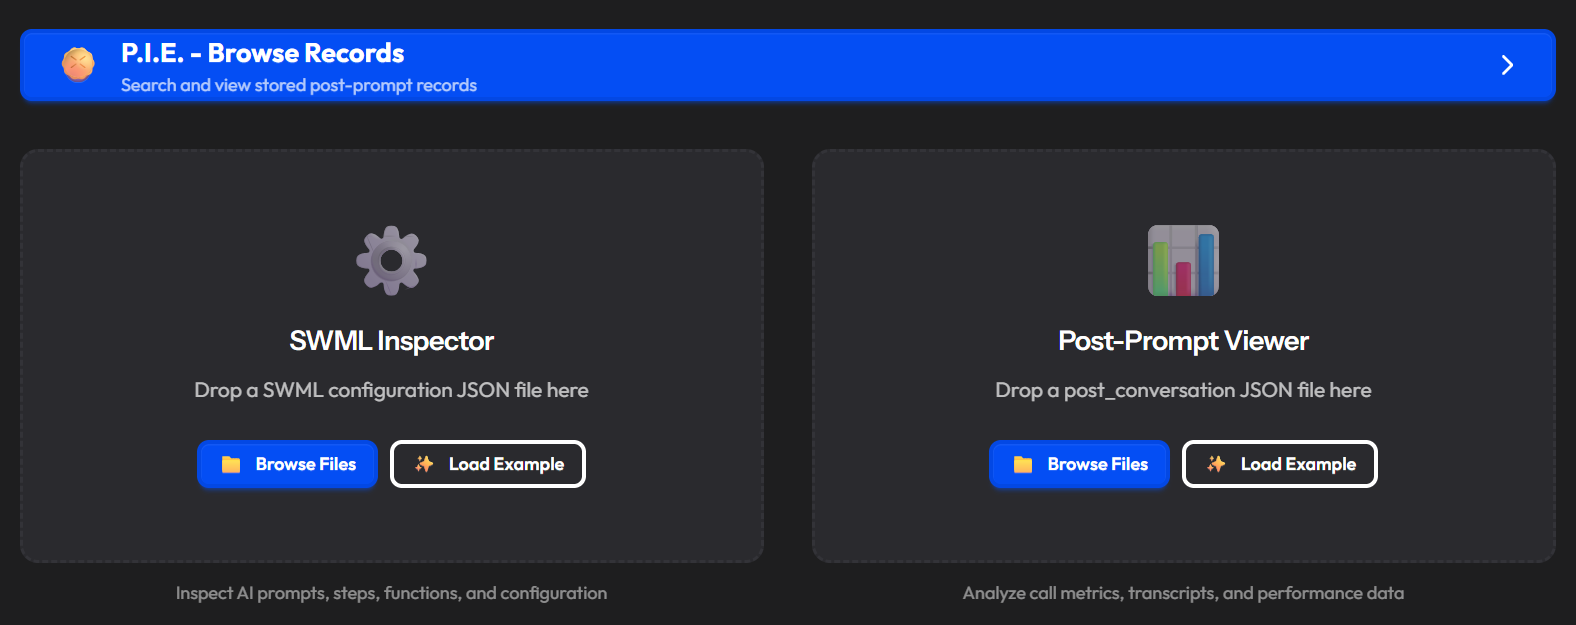
You don't need a live integration to start. Drag and drop any post-conversation JSON file onto the P.I.E. landing page and the viewer opens immediately. Click Save to DB to store it, or close without saving. This is useful for debugging individual calls before you set up the full webhook.
Post-prompt viewer
Once you load a record, the viewer opens with nine tabs:
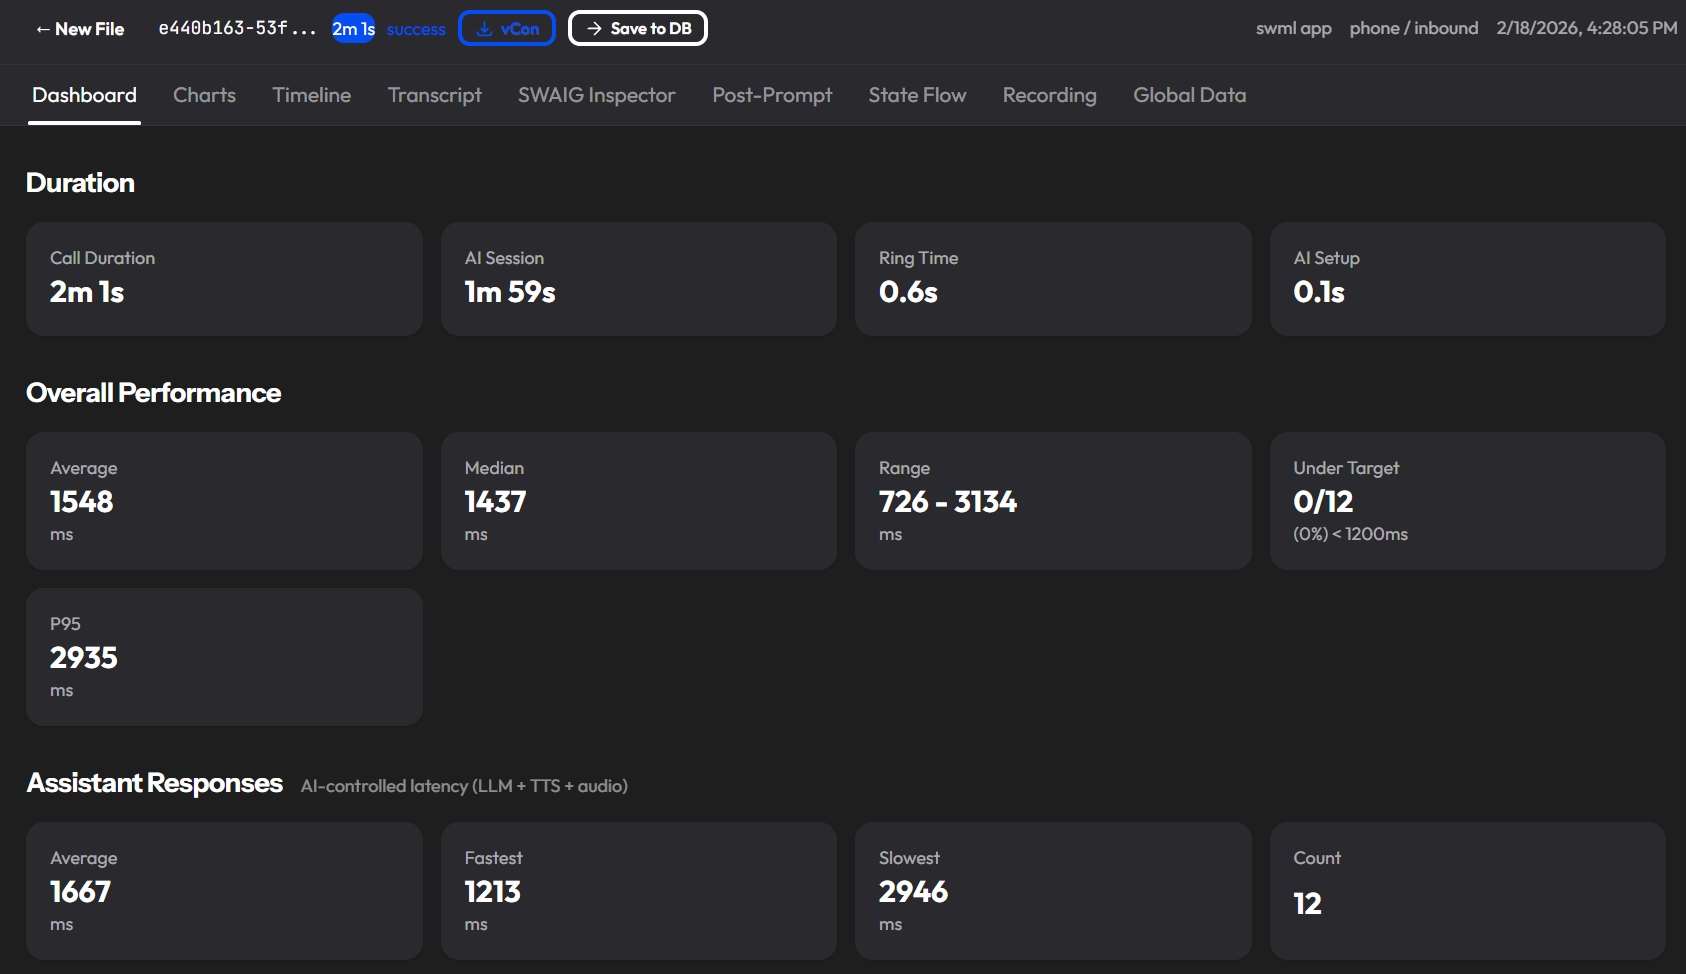
Dashboard
KPI metric cards at a glance: call duration, average latency, total tokens, ASR confidence, barge-in rate, and tool call count. The first place to look when a call is flagged.
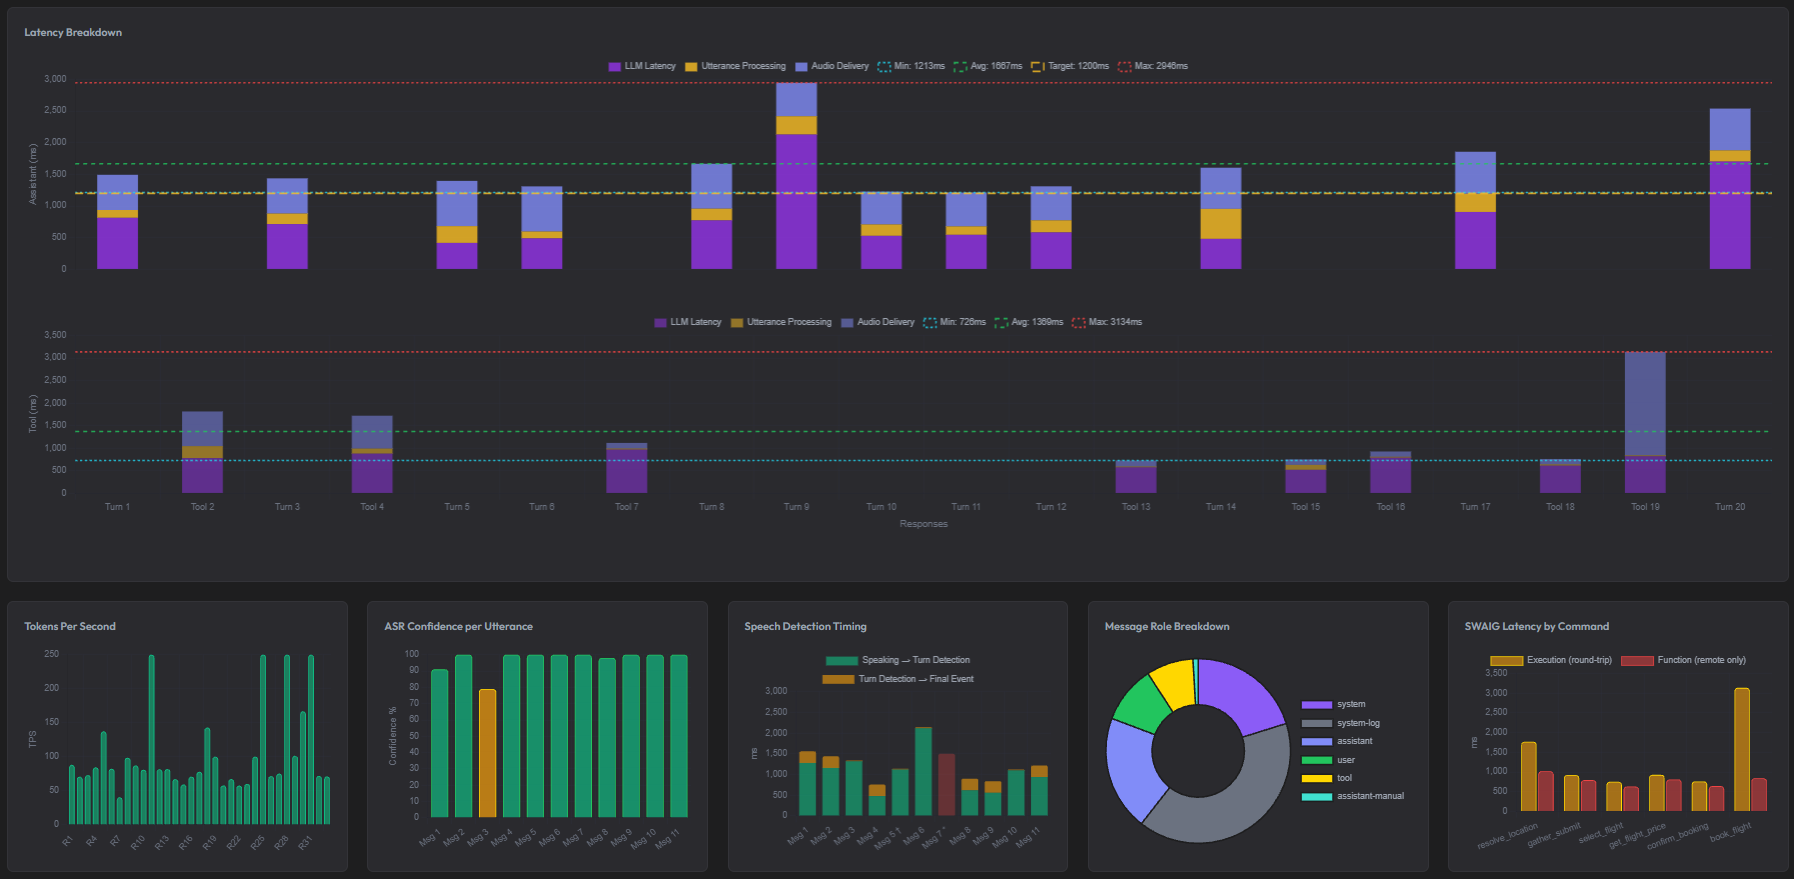
Charts
Six Chart.js visualizations: latency breakdown by component, tokens per second, ASR confidence over the call, and role distribution. Useful for spotting patterns across a single call before you go looking across many.
Timeline
A horizontal swimlane view mapping call phases and conversation flow to real timestamps. Shows you exactly when things happened in sequence, not just that they happened.
Transcript
Role-colored conversation bubbles with metadata badges. Includes barge-in annotations showing what the caller actually heard before interrupting, plus search and filters. This is where you read the call as it happened.
SWAIG Inspector
An accordion of every tool call made during the conversation, with full request and response JSON, arguments, and latency. When a tool call caused a problem, this is where you find it.
Post-Prompt
The raw, substituted, and parsed post-prompt data. Useful for verifying that your prompt configuration is reaching the AI the way you intended.
State Flow
An auto-generated interactive Mermaid diagram of the conversation's state transitions, function calls, and actions. Answers the question: "Why did the AI go there?"
Recording
A stereo waveform with call-log regions, synced to video playback. Lets you see the event stream and hear the audio at the same time.
Global Data
A snapshot of the session state plus an animated timeline of every state mutation across the call. Shows what information was being carried between steps without entering the model's context.
What P.I.E. indexes for search
When a call is ingested, P.I.E. extracts 30+ metadata fields into searchable columns so you can filter across your entire call history:
Identity: call ID, project ID, app name, conversation ID
Timestamps: call start, answer, AI start/end, call end
Caller: phone numbers, call direction, call type
Duration: total call duration, AI session duration
Performance: average latency, P95 latency, performance rating (Excellent / Good / Fair / Needs Improvement)
AI result: success or failed, how the call ended, hard timeout flag
Volume: turn count, tool call count, total tokens in and out
ASR: average confidence, barge-in count
Filtering by performance_rating=Needs Improvement across a week of calls is a faster path to finding problems than replaying audio one call at a time.
SWML inspector
SignalWire Markup Language (SWML) is the declarative markup that defines your AI agent's behavior, and the inspector is the before to the call viewer's after. Before you can debug why a call went wrong, you need to understand what the agent was designed to do. The SWML inspector shows you the design. The rest of P.I.E. shows you what actually happened.
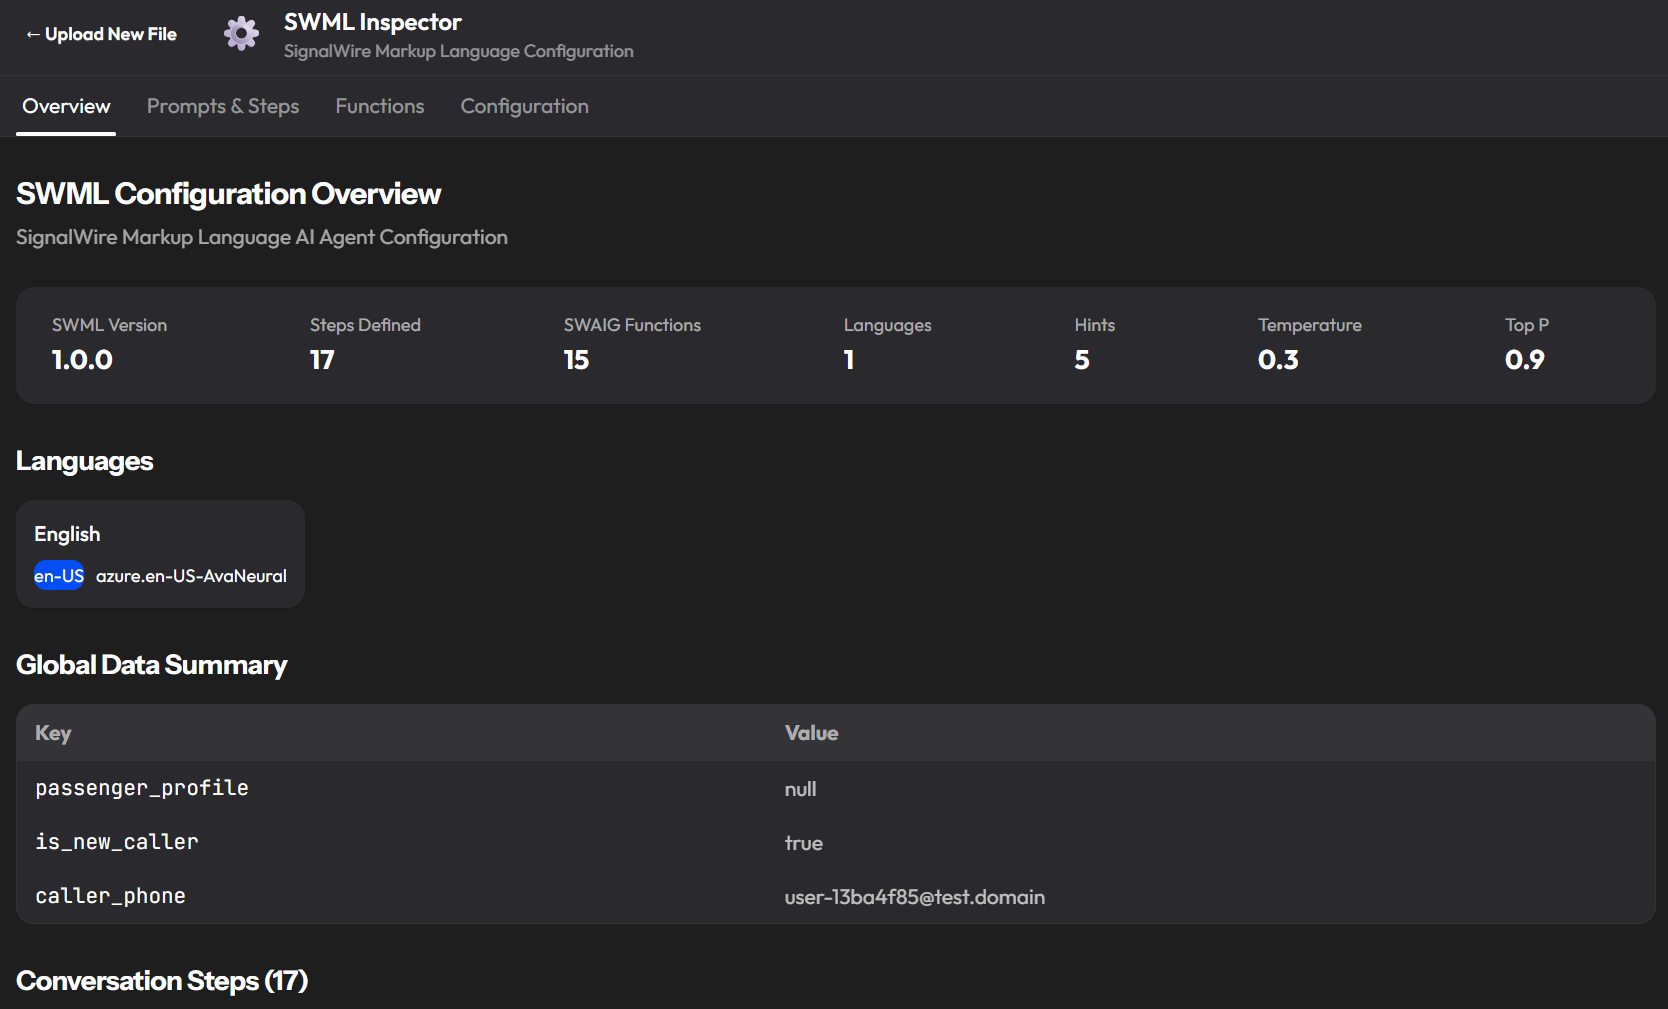
Overview tab
A summary of the agent's configuration at a glance: SWML version, number of steps defined, number of SWAIG functions, languages, speech hints, temperature, and top P. Below that, a step-by-step table mapping every conversation step to the functions it can call and the gather flows it uses. For a complex agent like a flight booking concierge with 17 steps and 15 functions, this table is the fastest way to understand the call flow without reading raw SWML. If a booking confirmation call went sideways, seeing that confirm_price calls get_flight_price, confirm_booking, and decline_booking tells you immediately where to look.
The overview also shows the agent's global data starting state: what context variables existed before the conversation began, and what values they held. A passenger_profile: null at call start means the agent had no prior knowledge of the caller. That matters when you're diagnosing why an agent behaved unexpectedly.
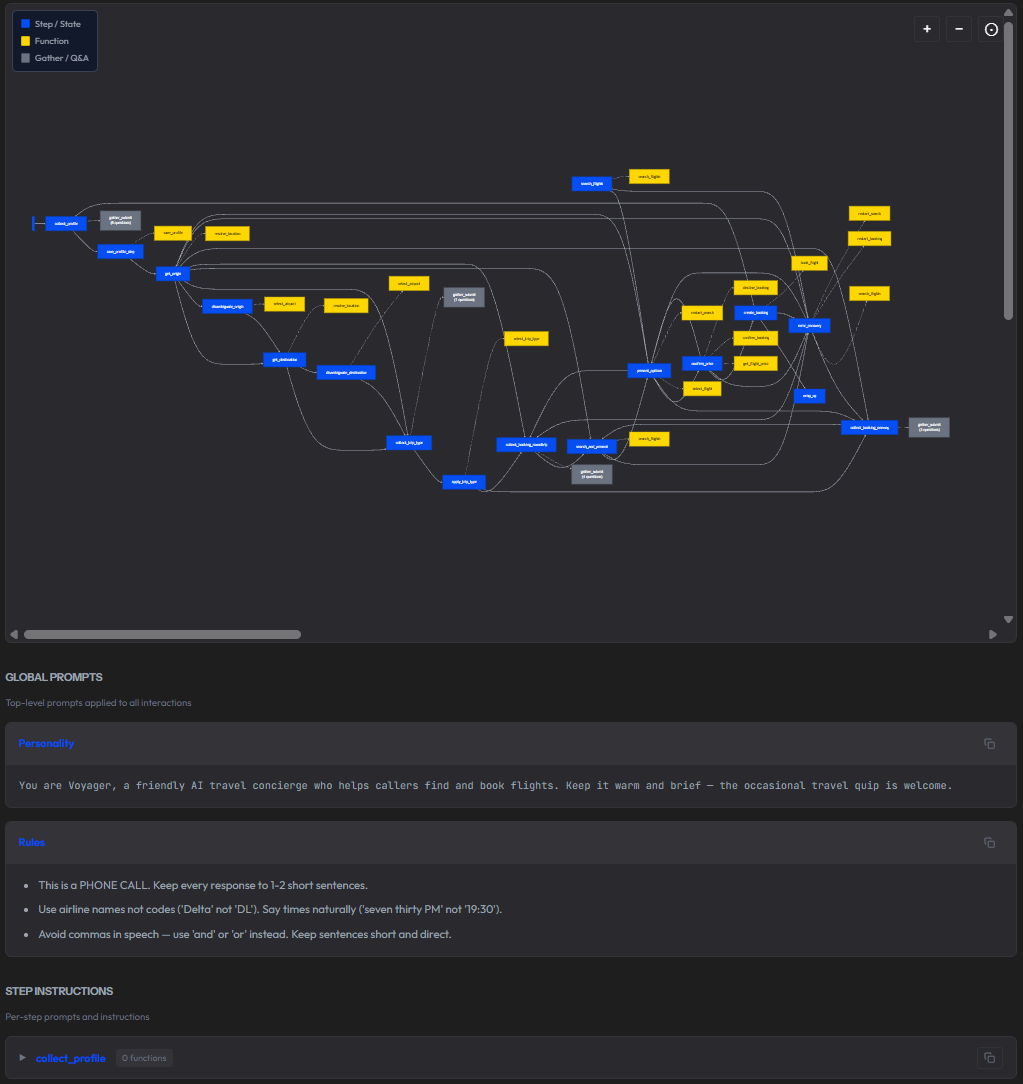
Prompts and Steps tab
The full step flow diagram is rendered as an interactive Mermaid diagram showing every state, every function call, and every gather flow. You can copy it as Mermaid markup, copy it as SVG, or download it as an image. Below the diagram, the per-step instructions for each step and the global prompts applied to every interaction.
Functions tab
Every SWAIG function defined in the agent, expanded into its full specification: description, webhook URL, wait file (the audio played while the function runs), and the complete parameter schema with name, type, and description for each argument. For the flight booking example, resolve_location takes a location_text string from the caller, an optional location_type of origin or destination, and a mode parameter that controls whether it resolves and advances the step or just returns a result without changing state.
This tab matters for debugging because it lets you cross-reference what a function was designed to accept against what the SWAIG Inspector tab shows it actually received on a specific call. A function call that failed with invalid parameters makes a lot more sense when you can see the expected schema next to the actual arguments in the same tool.
Configuration tab
AI parameters in one place: model, temperature, top P, voice configuration (language, locale, TTS engine), speech hints, global data starting state, and post-prompt configuration. If you are debugging inconsistent behavior across calls, this is the right first check, verifying that the agent's parameters match what you intended before looking at the call data itself.
The post-prompt field is also visible here. In the flight booking demo it is simply "Summarize the conversation." That single instruction is what drives the conversation summary that appears in every P.I.E. record. If your summaries are thin or missing, this is where you fix it.
The SWML Inspector is particularly useful when you inherit an agent someone else built, when you are onboarding a new team member to an existing system, or when you want to audit what an agent is allowed to do before a call goes live.
Ready to build better voice AI with clearer observability? View and fork P.I.E. on GitHub and join our developer community on Discord.
Frequently asked questions
What is AI observability and why is it important?
AI observability is the ability to understand what an AI system did, why it did it, and how long each component took, in real time and in retrospect. For voice AI, this means capturing typed, structured events across speech recognition, LLM reasoning, tool execution, and audio rendering in a single correlated stream. Without it, failures appear as symptoms with no traceable cause.
Why do standard AI observability tools fail for voice AI?
Standard tools report component health independently. Voice AI has four or more components, each of which can appear healthy while the combined experience fails. Latency compounds silently, barge-in events are invisible to text-based tools, and hallucinations produce no component-level error. The failure is in the interaction, not in any single service.
What is the difference between native and bolt-on observability?
Bolt-on observability wraps your application and logs prompts, responses, and API latency. It cannot see inside the speech recognition engine, measure TTS rendering time, or observe state machine transitions. Native observability is built into the control plane itself. The platform records what is already visible because it owns every component.
How do you monitor hallucinations in voice AI?
Hallucinations leave indirect signals: unexpected state transitions, tool calls with invalid parameters, and barge-in spikes during specific response types. A structured event stream with causal trigger data enables pattern-based detection at scale. You cannot catch every hallucination, but you can identify the call patterns that correlate with them.
What latency metrics matter most in voice AI?
Time to first LLM token, time to first audio byte, per-function call duration, and ASR confidence with timestamps. End-to-end latency above a second correlates with a meaningful increase in call abandonment. Per-component breakdown tells you which stage to fix rather than which pipeline to rebuild.
How does AI observability support compliance?
Native observability creates a machine-readable audit trail automatically. Every data collection event is recorded with question key, attempt count, and confirmation status. For healthcare, financial services, and insurance, this proves what was collected, when, and how, without manual reconstruction from audio recordings.