
Article
3 min read
read
Introducing the SignalWire Voice Analytics Dashboard
Observability and voice analytics

Dani Plicka
Content Marketing Manager


Subscribe
Tags
Latency & Performance
Voice AI
SignalWire's new Voice Analytics Dashboard gives teams a project-level view of voice call health — including MOS scores, ASR, post-dial delay, and more — directly inside SignalWire Spaces.
Better voice analytics and observability
Understanding the health of your voice infrastructure shouldn’t require stitching together logs, building custom dashboards, or guessing where problems start.
The new SignalWire Voice Analytics Dashboard provides a centralized, project-level view of voice performance so teams can monitor call health, identify issues faster, and understand operational trends without building custom observability workflows.
Starting March 20, the dashboard will be available inside your SignalWire space.
In the lefthand sidebar, navigate to:
Analytics menu → Voice submenu
From there, you can view high-level metrics that help you evaluate overall voice health across your project.
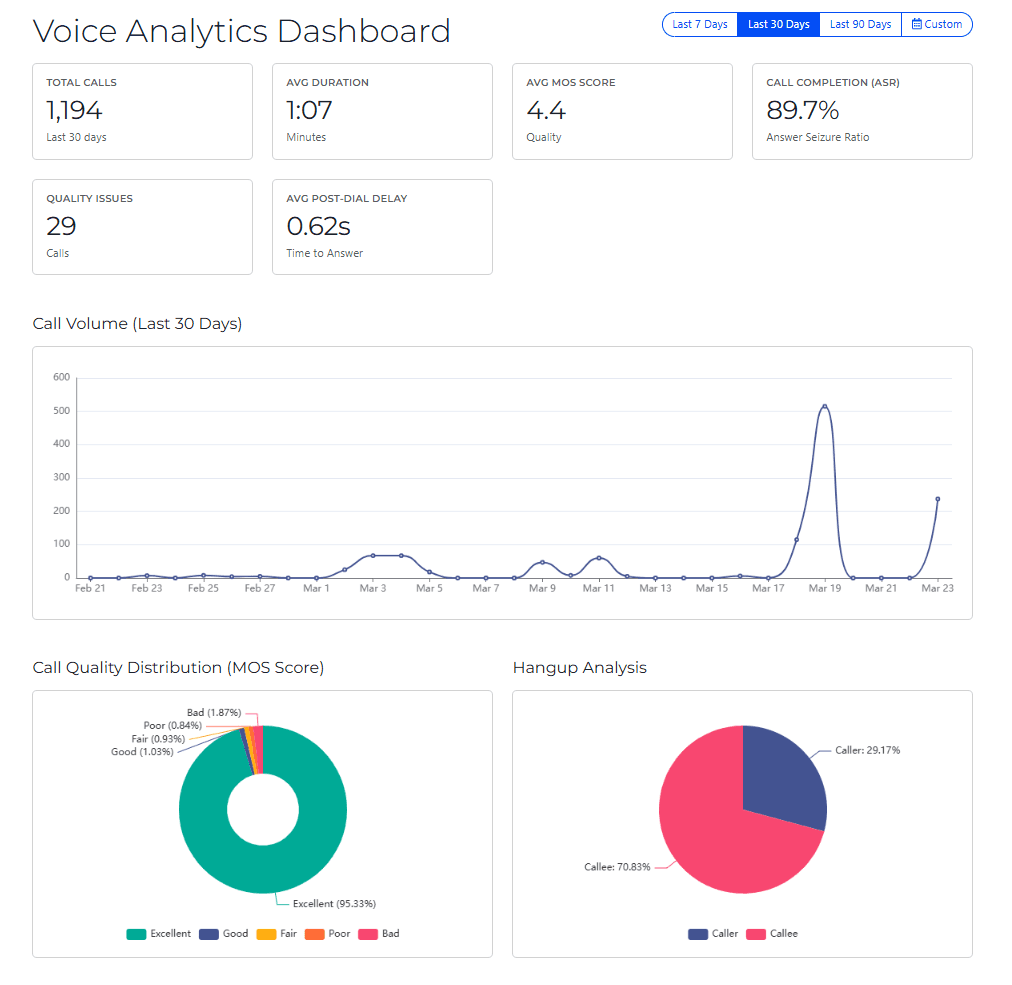
This new built-in observability tool gives teams a view of call completion rates, ASR, post-dial delay, MOS distribution, quality issues, and volume patterns without requiring custom-built monitoring workflows or manual data assembly.
By analyzing these signals, you get a quick look at routing problems, quality degradation, or abnormal traffic patterns.
Why voice observability matters
Historically, understanding voice call health meant pulling data manually, building custom dashboards, or waiting for customers to report issues. The new Voice Analytics Dashboard changes that by surfacing the metrics that matter most, in one place, at a glance.
Voice systems operate in real time and often involve multiple infrastructure layers including carriers, networks, APIs, and applications. Without strong observability, diagnosing problems can take hours or even days.
Voice observability helps teams:
Detect call quality degradation early
Monitor traffic patterns and usage spikes
Identify routing or carrier issues
Troubleshoot call failures faster
Maintain operational confidence in production environments
The Voice Analytics Dashboard is designed to provide a quick operational overview so teams can identify issues before they impact users.
What metrics does the Voice Analytics Dashboard track?
Key insights include:
Call completion and ASR trends
Understand how many calls successfully connect and identify patterns in failed calls. Monitor your Answer-Seizure Ratio — the percentage of initiated calls that are successfully answered — to measure the reliability of your voice infrastructure. A dropping ASR is one of the clearest signs that something in your call path needs attention.
Post-dial delay monitoring
Track the average time between when a call is placed and when it starts ringing on the other end. Elevated post-dial delay is often one of the first indicators of carrier or routing issues, making this a key metric for proactive troubleshooting.
Call quality distribution
See how your calls are distributed across five quality tiers — Excellent, Good, Fair, Poor, and Bad — based on Mean Opinion Score (MOS), the industry-standard measure of voice audio quality. Use this to quickly understand whether quality issues are isolated edge cases or a systemic trend across your project.
Hangup analysis
Understand who is ending your calls — the caller or the callee — and spot patterns that may indicate user experience problems or application logic issues. An unexpected shift toward callee-side hangups, for example, can be an early signal of routing or connectivity problems.
Voice traffic patterns
Analyze call volume over time to identify traffic spikes, usage trends, or unusual activity. See the average length of calls across your project, which can surface subtle issues that other metrics miss.
Together, these metrics provide a clear operational picture of voice health without requiring custom monitoring setups. Instead of manually aggregating logs or metrics, you can quickly interpret:
overall call health
emerging quality issues
performance trends
abnormal traffic behavior
This visibility helps teams move from reactive troubleshooting to proactive monitoring.
Start exploring voice analytics
The Voice Analytics Dashboard is one step toward deeper observability within SignalWire.
We are actively gathering feedback from users to help guide future improvements, including:
additional metrics
expanded analytics views
enhanced troubleshooting tools
If you’re using the dashboard, we’d love to hear what is most useful and what you’d like to see next. As you explore the dashboard, share your feedback with us so we can continue improving voice analytics and observability within SignalWire.
Frequently asked questions
What is MOS score and why does it matter?
MOS (Mean Opinion Score) is the industry-standard measure of voice audio quality, rated on a scale from Bad to Excellent. It gives you a reliable, standardized way to assess whether your callers are experiencing good audio — without relying on subjective complaints.
What is Answer-Seizure Ratio (ASR)?
ASR is the percentage of initiated calls that are successfully answered. It's one of the most reliable indicators of overall voice infrastructure health — a declining ASR is typically one of the first signs of a routing or carrier problem.
What causes high post-dial delay?
Post-dial delay (PDD) is the time between when a call is placed and when it starts ringing. Elevated PDD is most commonly caused by carrier routing issues, SIP signaling latency, or geographic routing inefficiencies.
What does Hangup Analysis tell me?
Hangup Analysis breaks down calls by who ended them — the caller or the callee. Shifts in that ratio can reveal user experience problems, application logic issues, or early signs of connectivity degradation.
Related Resources
